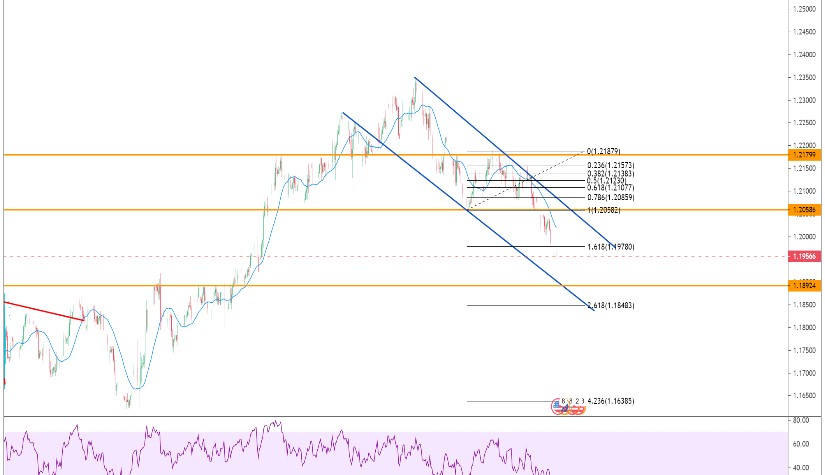
ราคาวิ่งลงมาตามกรอบเทรนไลน์ มีโอกาสที่ราคาจะลงไปที่ 1.18924 ซึ่งเป็นแนวรับ โดยราคาได้ลงไปต่ำกว่า Fibonacci ที่ 1.18924 แล้ว มีโอกาสที่ราคาจะลงไปตามกว่านี้สูง
Pivot Point
| Name |
S3 |
S2 |
S1 |
Pivot Points |
R1 |
R2 |
R3 |
| Classic |
1.1947 |
1.1949 |
1.1953 |
1.1955 |
1.1958 |
1.1961 |
1.1964 |
| Fibonacci |
1.1949 |
1.1952 |
1.1953 |
1.1955 |
1.1957 |
1.1958 |
1.1961 |
| Camarilla |
1.1953 |
1.1954 |
1.1954 |
1.1955 |
1.1956 |
1.1956 |
1.1957 |
| Woodie's |
1.1947 |
1.1949 |
1.1953 |
1.1955 |
1.1958 |
1.1961 |
1.1964 |
| DeMark's |
- |
- |
1.1954 |
1.1955 |
1.1959 |
- |
- |
Indicators
| Name |
Value |
Action |
| RSI(14) |
28.576 |
Sell |
| STOCH(9,6) |
36.514 |
Sell |
| STOCHRSI(14) |
62.575 |
Buy |
| MACD(12,26) |
-0.001 |
Sell |
| ADX(14) |
63.882 |
Sell |
| Williams %R |
-85.937 |
Oversold |
| CCI(14) |
-145.1906 |
Sell |
| ATR(14) |
0.0009 |
Less Volatility |
| Highs/Lows(14) |
-0.0004 |
Sell |
| Ultimate Oscillator |
43.408 |
Sell |
| ROC |
-0.204 |
Sell |
| Bull/Bear Power(13) |
-0.0028 |
Sell |
|
Buy:1
Sell:9
Neutral:0
Summary:Strong Sell
|
Updated
5 years ago
(Feb 05, 2021 11:16)