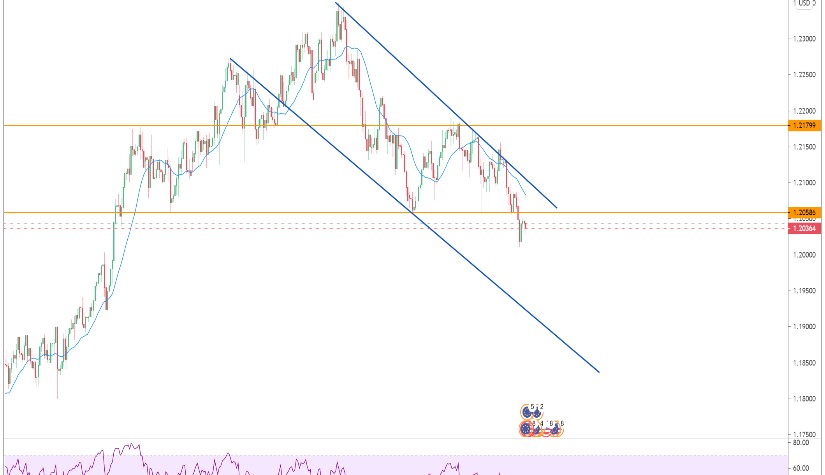
ราคาเข้าสู่เทรนขาลงอย่างเห็นได้ชัดเนื่องจากราคาได้ Breakout แนวต้านที่ราคา 1.20586 และวิ่งตามกรอบเทรนไลน์ มีโอกาสที่ราคาจะลงไปที่ 1.18924 ซึ่งเป็นจุดบริเวณ High ก่อนหน้า
Pivot Point
| Name |
S3 |
S2 |
S1 |
Pivot Points |
R1 |
R2 |
R3 |
| Classic |
1.2017 |
1.2022 |
1.2030 |
1.2035 |
1.2043 |
1.2048 |
1.2055 |
| Fibonacci |
1.2022 |
1.2027 |
1.2030 |
1.2035 |
1.2040 |
1.2043 |
1.2048 |
| Camarilla |
1.2034 |
1.2035 |
1.2036 |
1.2035 |
1.2038 |
1.2039 |
1.2040 |
| Woodie's |
1.2017 |
1.2022 |
1.2030 |
1.2035 |
1.2043 |
1.2048 |
1.2055 |
| DeMark's |
- |
- |
1.2026 |
1.2033 |
1.2039 |
- |
- |
Indicators
| Name |
Value |
Action |
| RSI(14) |
43.440 |
Sell |
| STOCH(9,6) |
58.085 |
Buy |
| STOCHRSI(14) |
59.815 |
Buy |
| MACD(12,26) |
-0.001 |
Sell |
| ADX(14) |
32.581 |
Sell |
| Williams %R |
-41.427 |
Buy |
| CCI(14) |
-21.2610 |
Neutral |
| ATR(14) |
0.0010 |
Less Volatility |
| Highs/Lows(14) |
0.0000 |
Neutral |
| Ultimate Oscillator |
56.118 |
Buy |
| ROC |
0.141 |
Buy |
| Bull/Bear Power(13) |
-0.0007 |
Sell |
|
Buy:5
Sell:4
Neutral:2
Summary:BUY
|
Updated
5 years ago
(Feb 03, 2021 15:54)