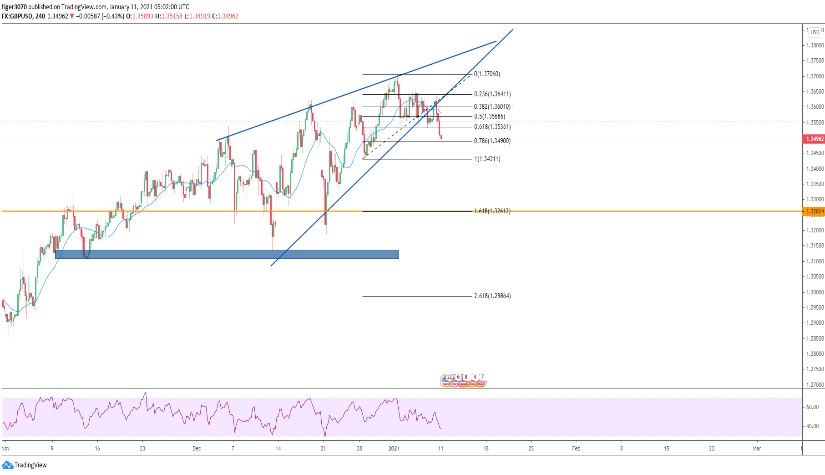
ราคาตอนนี้ได้ Breakout Price Pattern ไปเป็นที่เรียบร้อยแล้ว สัญญาณ RSI บ่งบอกถึงสภาวะขาลงที่ชัดเจน มีโอกาสที่ราคาจะลงไปที่ 1.32624 ซึ่งเป็นจุด Fibonacci ที่ 161.8 และ Moving Average เริ่มจะเป็นทิศทางขาลงแล้ว
Pivot Point
| Name |
S3 |
S2 |
S1 |
Pivot Points |
R1 |
R2 |
R3 |
| Classic |
1.3473 |
1.3482 |
1.3491 |
1.3500 |
1.3509 |
1.3518 |
1.3526 |
| Fibonacci |
1.3482 |
1.3489 |
1.3493 |
1.3500 |
1.3507 |
1.3511 |
1.3518 |
| Camarilla |
1.3494 |
1.3496 |
1.3497 |
1.3500 |
1.3501 |
1.3502 |
1.3504 |
| Woodie's |
1.3473 |
1.3482 |
1.3491 |
1.3500 |
1.3509 |
1.3518 |
1.3526 |
| DeMark's |
- |
- |
1.3486 |
1.3498 |
1.3504 |
- |
- |
Indicators
| Name |
Value |
Action |
| RSI(14) |
31.089 |
Sell |
| STOCH(9,6) |
20.206 |
Sell |
| STOCHRSI(14) |
0.000 |
Oversold |
| MACD(12,26) |
-0.002 |
Sell |
| ADX(14) |
57.740 |
Sell |
| Williams %R |
-95.312 |
Oversold |
| CCI(14) |
-119.1535 |
Sell |
| ATR(14) |
0.0018 |
Less Volatility |
| Highs/Lows(14) |
-0.0034 |
Sell |
| Ultimate Oscillator |
41.297 |
Sell |
| ROC |
-0.637 |
Sell |
| Bull/Bear Power(13) |
-0.0067 |
Sell |
|
Buy:0
Sell:9
Neutral:0
Summary:Strong Sell
|
Updated
5 years ago
(Jan 11, 2021 12:05)