Within the investment industry, repetitive fluctuations in price are often utilized by investors to exchange assets they anticipate will deliver more profit than loss. A distinguished theory that relies on this market phenomenon for observing price progressions is the Elliott Wave, a tool held in high regard amongst traders.
This article aims to shed light on the Elliott Wave trading strategy, its integral tenets, and its practical application for investors who lean towards technical analysis. This approach allows them to make more informed decisions when starting and wrapping up trades.
An Overview of the Elliott Wave
The Elliott Wave is a theoretical framework used for market assessment that mainly focuses on price patterns visible across different periods. These patterns propose a potential future price direction. Ralph Nelson Elliott, the theory's creator, put forth this idea in 1930 and elaborated on it in his book, "Wave Principle."
Fundamental Principles of the Elliott Wave
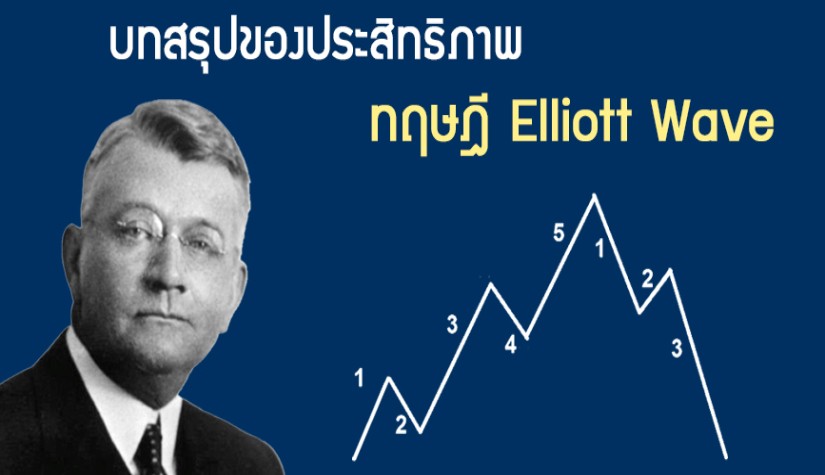
The Elliott Wave declares that market cycles repeat due to investor behavior, causing recurring price shifts. Thus, when traders notice a distinct but recurrent pattern on a chart, it is often dubbed a price swing. The upward movement is called the Impulse wave, and the downward movement is the Corrective wave. These patterns aid in forecasting future chart trends.
Understanding the Impulse Wave
Impulse Waves include five successive upward waves:
Wave 1: The recovery from a decreasing trend or the conclusion of a Corrective wave. It signifies the start of price changes.
Wave 2: A fundamental modification of the upward trend, triggered by investors selling due to a perceived excess rise from the downward trend. This wave creates buying conditions.
Wave 3: Usually the longest wave in the upward trend, Wave 3 confirms Waves 1 and 2 and can help forecast the objectives of Waves 4 and 5.
Wave 4: A selling influence resulting from the three prior waves used to profit. Wave 4 creates buying pressure as prices decrease.
Wave 5: Often referred to as the "crowd" wave, this is driven by smaller investors placing orders as they notice a price rise on the chart.
The Corrective Wave
The Corrective Wave comprises three downward waves:
Wave A: Investors deem the price too abrupt, resulting in selling pressure that brings down the price. Generally, the price will drop to 25–50% of the length of Wave 3. After the price has descended, there will be buying pressure from investors who anticipate that the price will readjust upward.
Wave B: As prices decrease from Wave A, investors buy to assemble the portfolio, hoping for a rise beyond the peak of Wave 5. Prior to reaching this resistance, primary investor groups will commence selling. These forces force Wave B to rise to 75% of the vertical distance from Wave 5.
Wave C: Prompted by the selling pressure of sizable investors, leading to significant losses due to the vertical price drop. A signal that Wave C has occurred is that the price has surpassed the low of Wave A.
Conclusion
The Elliott Wave can assist in determining whether a price trend is escalating or declining. Yet, it does not evaluate the variations within that duration and hinges on somewhat complex technical analysis methods. Thus, before leveraging it, investors must gain an in-depth understanding of the Elliott Wave and depend on diverse technical instruments to analyze and confirm entry points for enhanced trading efficiency.
______________________________
Maximize your knowledge: Blog
Keep up to date on global events: News
Updated
1 year ago
(Jun 09, 2023 10:14)